Applied MathematicsStatistics |
What is the standard deviation? |
The standard deviation is considered by some to be the second most important statistic (or statistical measure) in the field; it is the measure of how much the individual observations are scattered about the mean. In general, the more widely values are spread out, the larger the standard deviation. For example, if the test results for two different exams taken by 50 people in a geology class range from 30 to 98 percent for the first exam and 78 to 95 percent for the second exam, the standard deviation is larger for the first list of exams. This spread (dispersion) of a data set is calculated by taking the square root of the variance; the notation for standard deviation is most commonly seen as follows:  (or simply s), in which V(x) is the variance.
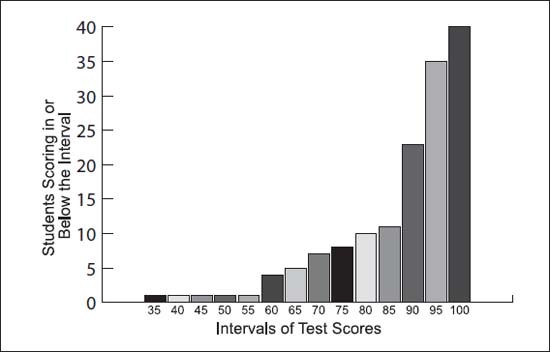
In this example of a cumulative distribution chart, all students (100 percent) fall within the maximum score of 100, while smaller numbers of students fall within each progressively lower score on a test.